December 6, 2017 CAN Log Viewer update with DTC support for J1939 engines
The new version of CAN Log Viewer can show lamps and active diagnostic trouble codes (DTC) of J1939 engines. It allows diagnosing an engine in a real time or troubleshooting an engine using Engine Gateway YDEG-04 logs.
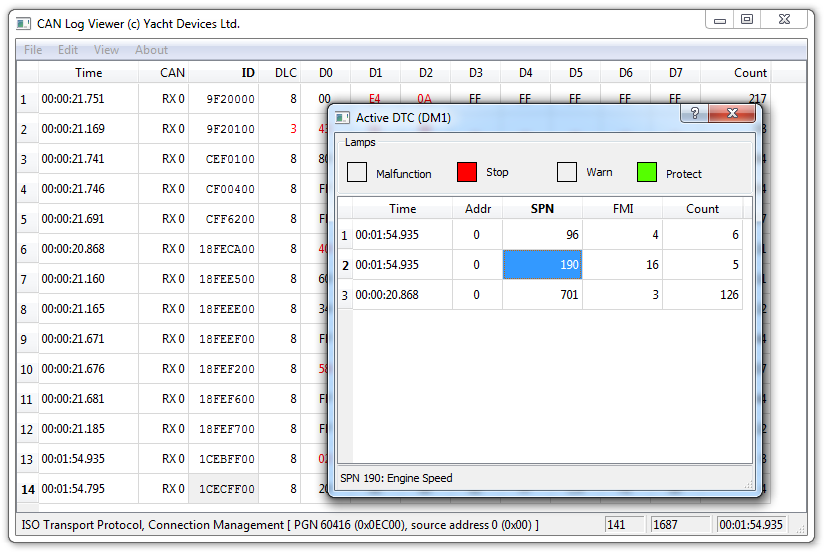
A DTC (diagnostic trouble code) is a pair consisting of an SPN (parameter number) and an FMI (failure mode identifier) code sent by a J1939 device (identified by an address) along with an error counter. For example, a device with the address 0 (the address of the port engine) sends the SPN 190 (Engine Speed) together with FMI 16 (Data Valid But Above Normal Operating Range - Moderately Severe Level). This means that the port engine revolutions are above normal.
To view the active DTC list, click the "J1939 Active DTC" item in the "View" menu. The window that opens (see the screenshot above) contains the list of all DTC sorted by sender address, SPN and FMI (collected after opening of the window). The CAN Log Viewer contains a built-in database with more than 2000 descriptions of SPN and FMI codes and J1939 addresses. You can select a cell with its address, or SPN or FMI code, to get its description in the window's status bar. It is probable that you will not need a manual to understand what has happen.
Four lamps (their state is sent with DTC) at the top of the window acts as described in the J1939 standard, they can flash, flash fast or be on. Note that if you have two engines and both have active DTC (or if two or more other devices with problems), the lamps in the window may blink unexpectedly because they correspond to the data received in the last DTC message with the correct lamp status. However, this situation is rare in practice.
If you are an Engine Gateway owner, it's all easy. Open the window, open the log file, and see how the situation is developing. Opening the J1939 Engine windows may help you understand the engine state at the time when a problem arises.
To monitor J1939 equipment in real time, you need our USB Gateway or Wi-Fi Gateway, because these products are only possible sources of real time data for CAN Log Viewer. Both products can be directly connected to the engine's J1939 network, but usually this is not convenient, because they are equipped with NMEA 2000 connectors, and you will need to assembly a custom adaptor.
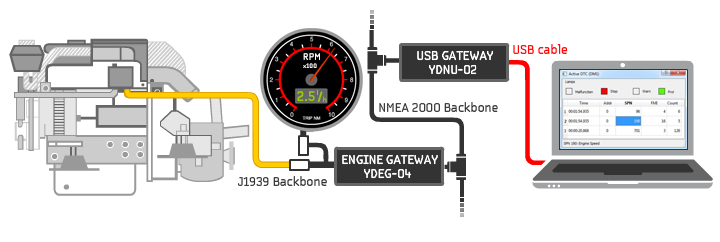
Figure 1. Real time engine diagnostics
However, the Engine Gateway can help. You can connect a USB or Wi-Fi Gateway to NMEA 2000 and configure the Engine Gateway to pass-thru J1939 PGNs 65226, 60416 and 60160 to get messages with active DTC in the NMEA 2000 network (see Figure 1). You should only add two lines to the configuration file:
    PASS_PGN=65226,60416,60160
    PASS_ADDR= AS_IS
If you have an Engine Gateway and a USB or Wi-Fi Gateway, you can even assembly a special NMEA 2000 "micro network" for diagnostics with these two devices simply to avoid hell with adaptors and cables. In case of the Wi-Fi Gateway, you can drop a "micro network" near the engine and monitor the data at any comfort place in Wi-Fi coverage area.
You can download the new version of CAN Log Viewer at Downloads page. This product is free and works on Microsoft Windows, Mac OS X and Linux.
Next articles:
- Web Gauges and new sentences support / November 16, 2017
- CAN Log Viewer update 1.06 for Windows, Linux and Mac
OS X / November 8, 2017 - How to set up a pair of Wi-Fi Gateways as a NMEA 2000 wireless bridge / November 7, 2017
Previous articles:
- Firmware 1.02 for J1708 Engine Gateway / December 8, 2017
- Happy New Year and Merry Christmas / December 25, 2017
- Meet us at the Dusseldorf Boat Show / January 17, 2018
See also: recent news, all news...