May 16, 2016 Your own depth map with Voyage Recorder and ReefMaster
Many charts are good enough for big ships, but not adequate for fishing or sailing vessels. This article shows how to create your own depth map to use in Google Earth or other software.
This year we opened our sailing season by cruising from Kaliningrad to Bornholm and back. This is a pleasant 360 nm voyage along the Slupska bank of the Baltic Sea. We love to fish for cod on this bank, but the chartered depths are not very accurate despite the fact that it is a very popular place.
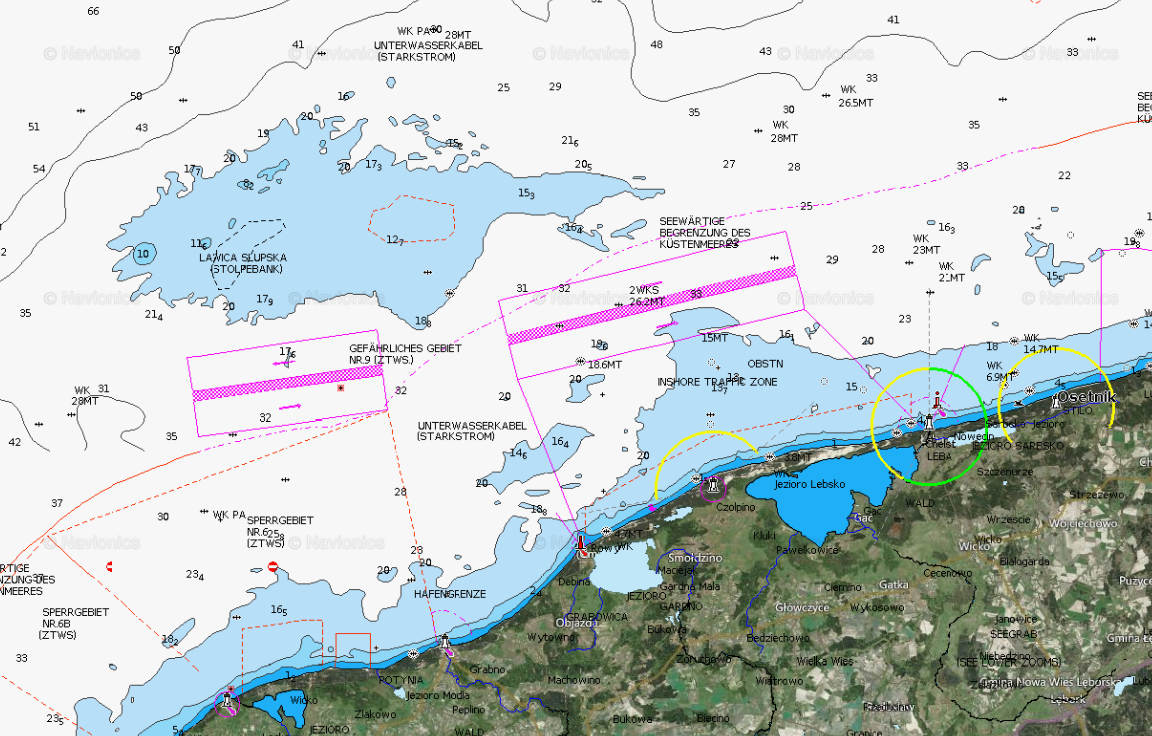
Our Raymarine C90W chart plotter is powered by Navionics chats, which are similar to the one above. It is enough to find the bank, but not enough for fishing for cod, who like to feed on the slopes.
Voyage Recorder's data contains time, position, depth, and much more sailing data. Using it with ReefMaster software for Microsoft Windows, you can create your own depth chart easily.
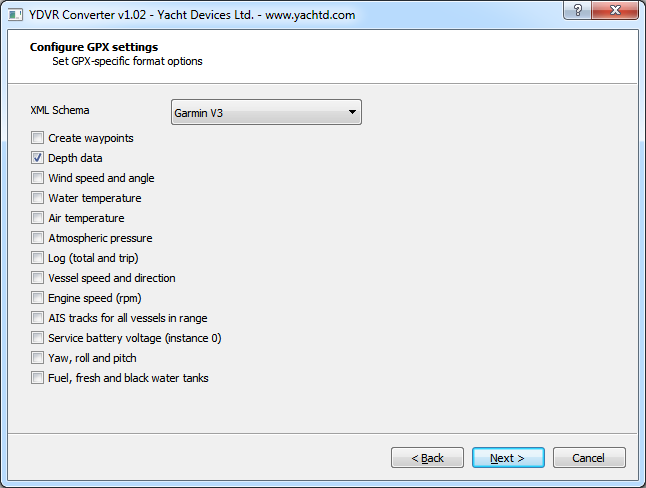
At first, you need to convert Voyage Recorder's data to a GPX file using the free YDVR Converter tool. Select the "Garmin V3" schema and check "Depth data" on the GPX configuration page (see pic.2).
Then download and install the 14-day trial version of Reef Master software. The full version of this software costs USD $149 and most of the export/save functions are disabled in the trial version, but simple things can be done with it.
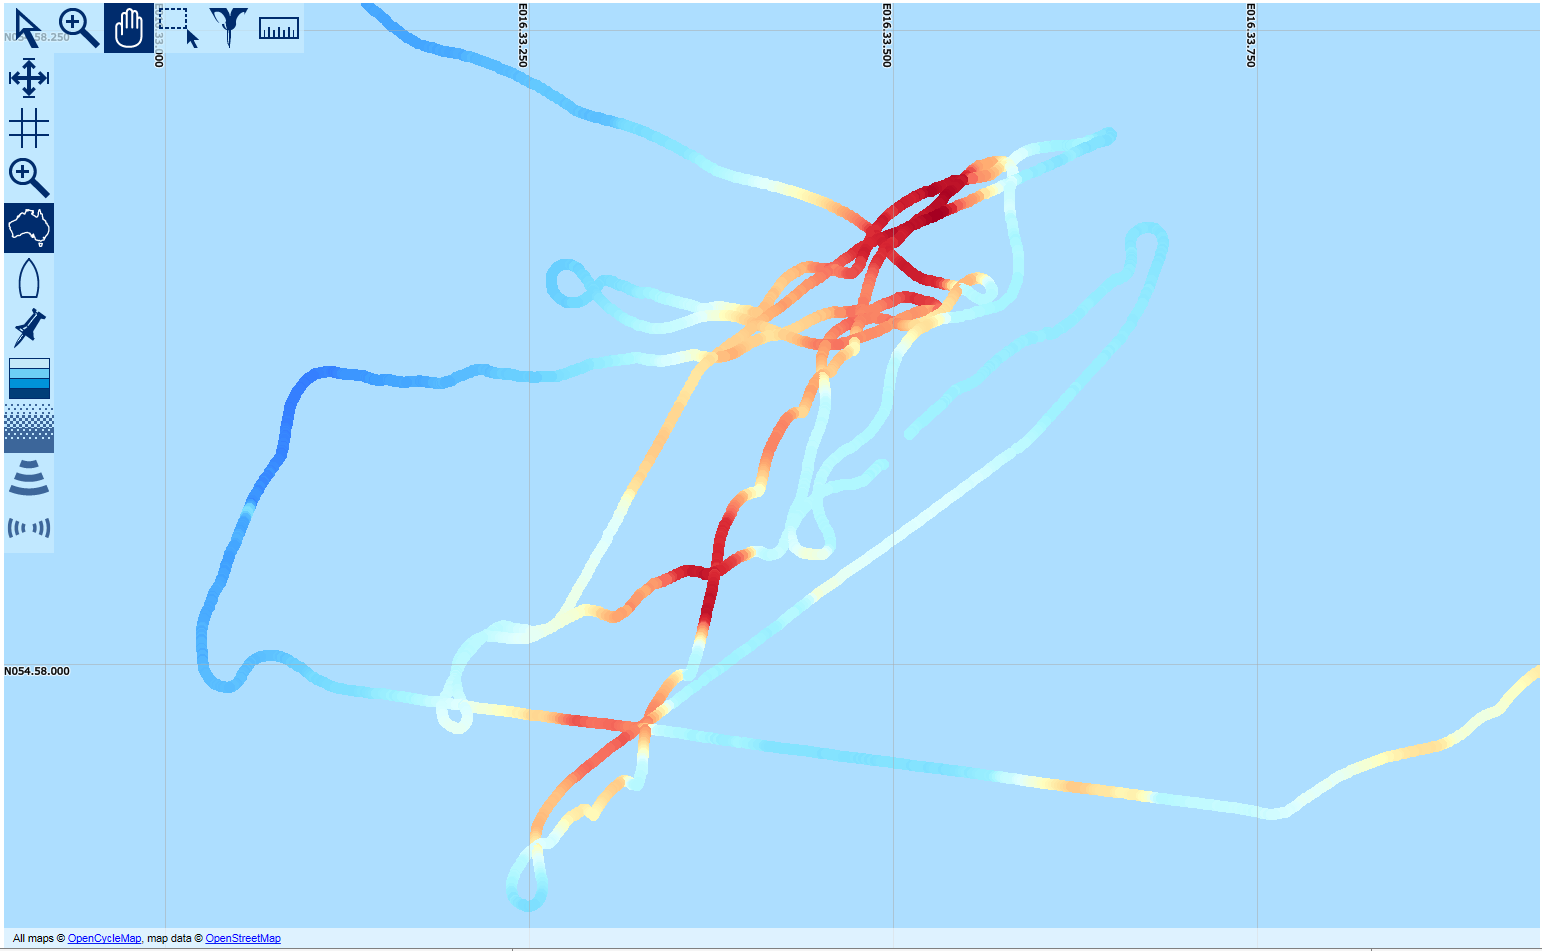
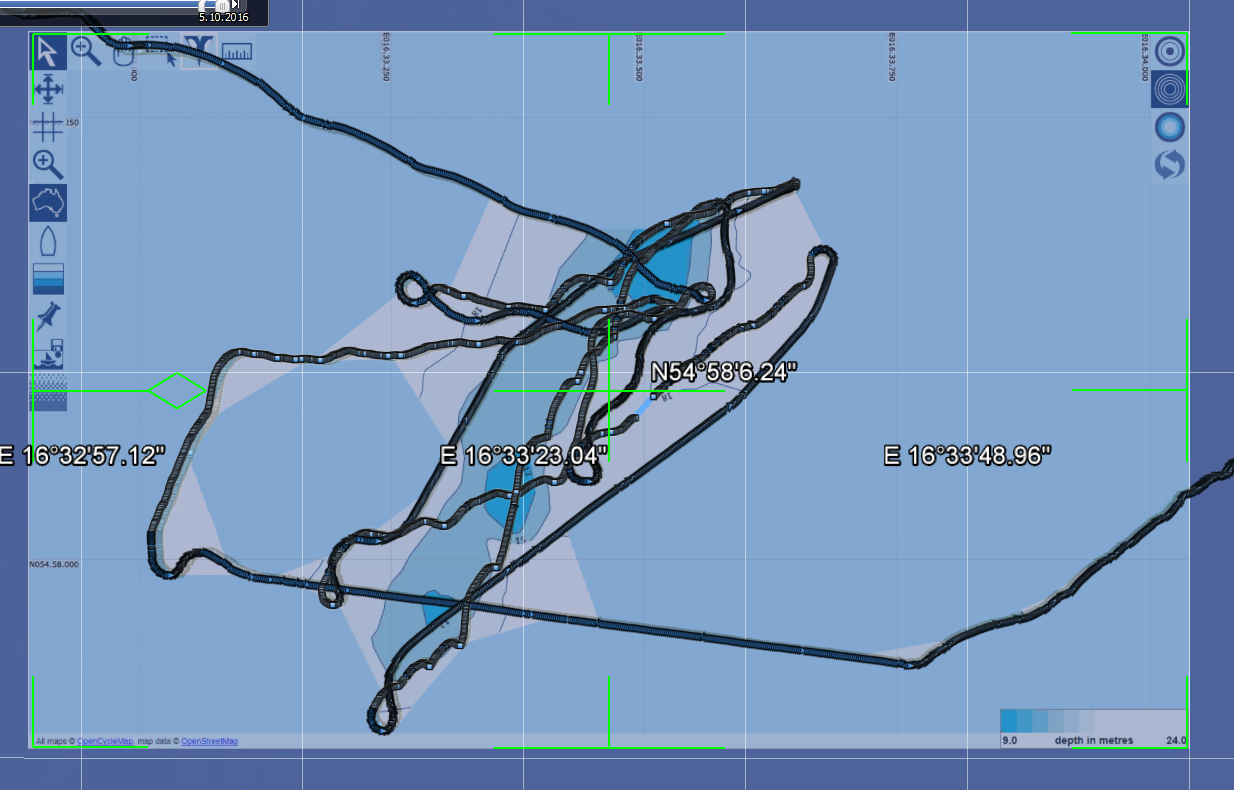
Import your GPX file to ReefMaster with the "Import GPS assets" button and you'll see something like the picture above. In our case, it is the simple fishing track colored by ReefMaster according to depth. Of course, the results will be better if your "scan" of the seabed is more accurate.
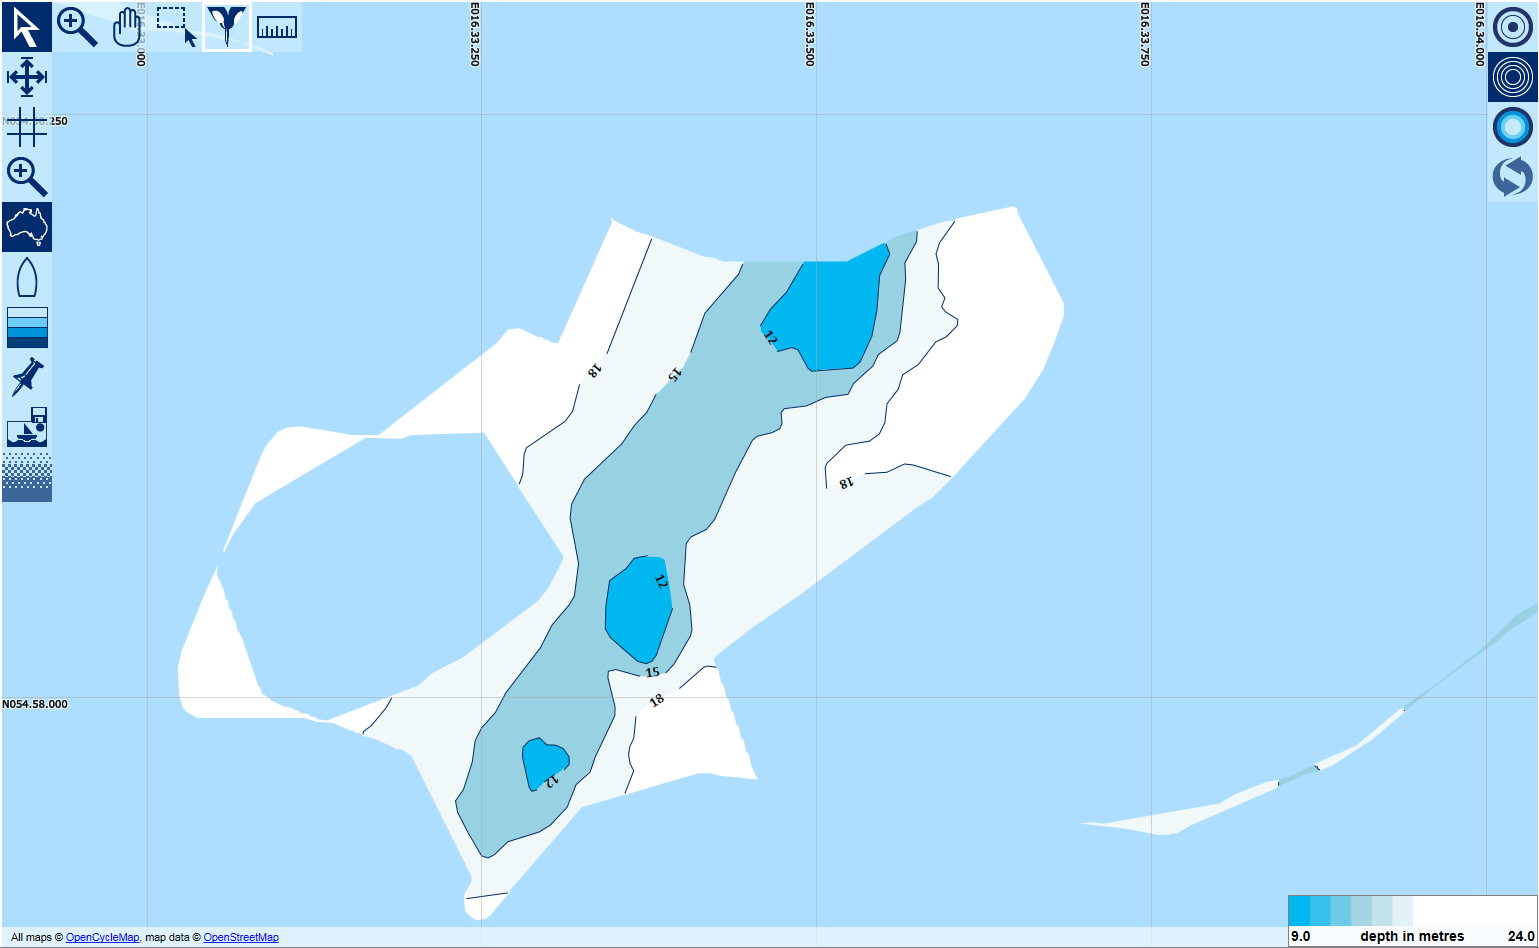
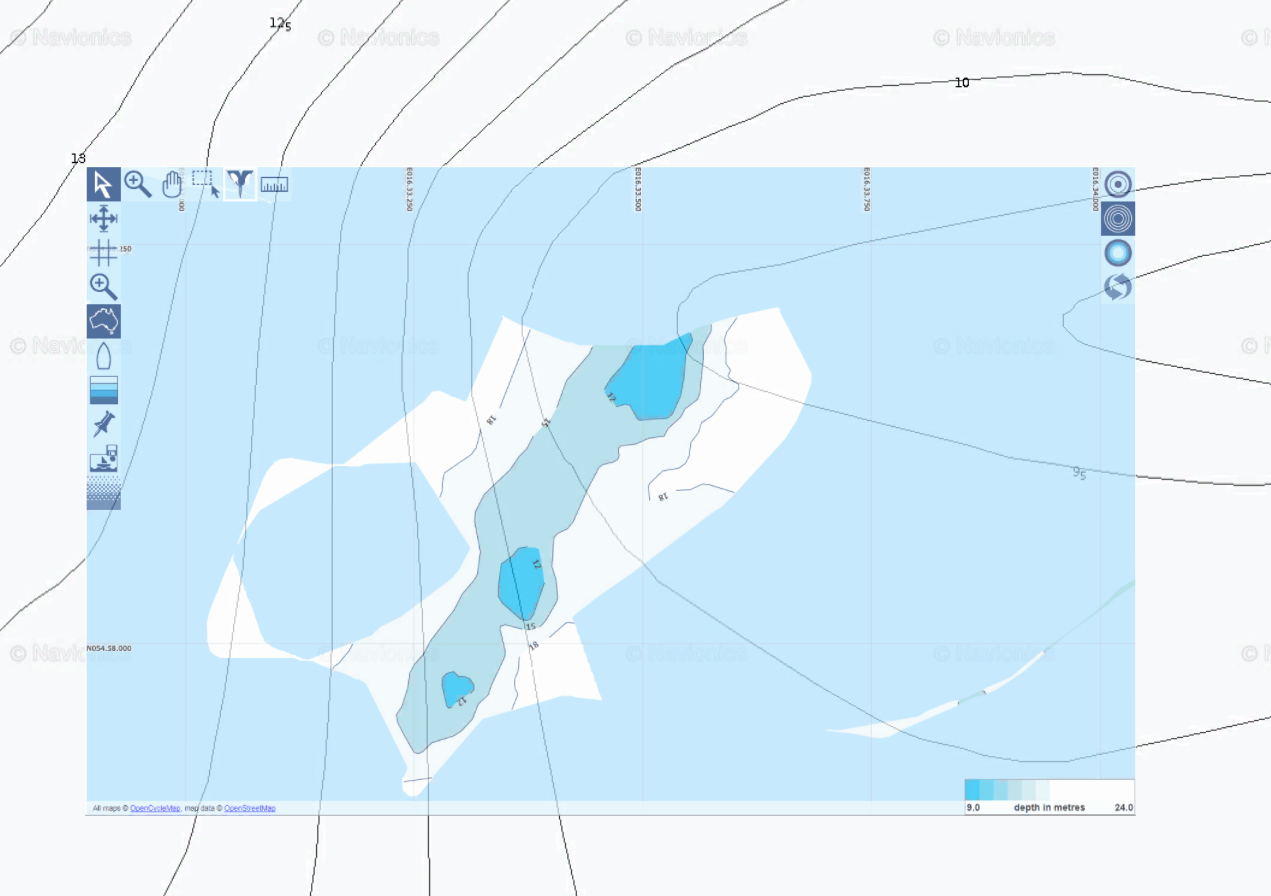
The ReefMaster interface is a bit tricky, but in this short video you can see what buttons to press to generate the depth chart. In the map settings, you may adjust interpolation and grid smoothing. This will determine the way that the program interprets the data to make a model of the seabed. In any case, after a few clicks you'll get a result like the one in the picture below. The depth on our chart varies from 21 to 12 meters.
ReefMaster can generate maps for Garmin, Lowrance and Humminbird plotters, Google Earth software, and some other formats. However, most of this export/save functionality is not available in the trial version.
If your chart is not large, you may use the print screen button and crop the image in any graphical editor. To upload the picture to Google Earth, select "New Image Overlay" in the "Add" menu. It is not necessary to position it on the coordinate grid. Just load your GPX file into Google Earth and adjust the image by track using the mouse. It is easy and takes only a few seconds.
Once your image is adjusted, you may export it to a KMZ or KML file. Many modern programs support these formats, and many tools can convert KMZ and KML files to other formats. In any case, KML is a simple text file, which contains a link to your map image and geographical coordinates of two corners. So you can use this data to adjust this image in other programs:
	<?xml version="1.0" encoding="UTF-8"?>
	<kml xmlns="http://www.opengis.net/kml/2.2"
	 xmlns:gx="http://www.google.com/kml/ext/2.2"
	 xmlns:kml="http://www.opengis.net/kml/2.2"
	 xmlns:atom="http://www.w3.org/2005/Atom">
	 <GroundOverlay>
		<name>ReefMaster</name>
		<color>8affffff</color>
		<drawOrder>10</drawOrder>
		<Icon>
			<href>slupskamap.png</href>
			<viewBoundScale>0.75</viewBoundScale>
		</Icon>
		<LatLonBox>
			<north>54.97155872352878</north>
			<south>54.96490391305584</south>
			<east>16.56716555735531</east>
			<west>16.54841772454264</west>
		</LatLonBox>
	</GroundOverlay>
	</kml>
How useful is our depth map in practice? Let's look at the Navionics Web App charts for a comparison. Picture 6 contains the "official" chart; the same that is loaded on our Raymarine C90W chart plotter. Picture 7 contains the fragment of Navionics SonarChart. It is the "unofficial" chart created by Navionics with the depth logs uploaded by users. The area of our chart is shown in the pictures by the red square; the size of one side is about half a nautical mile.
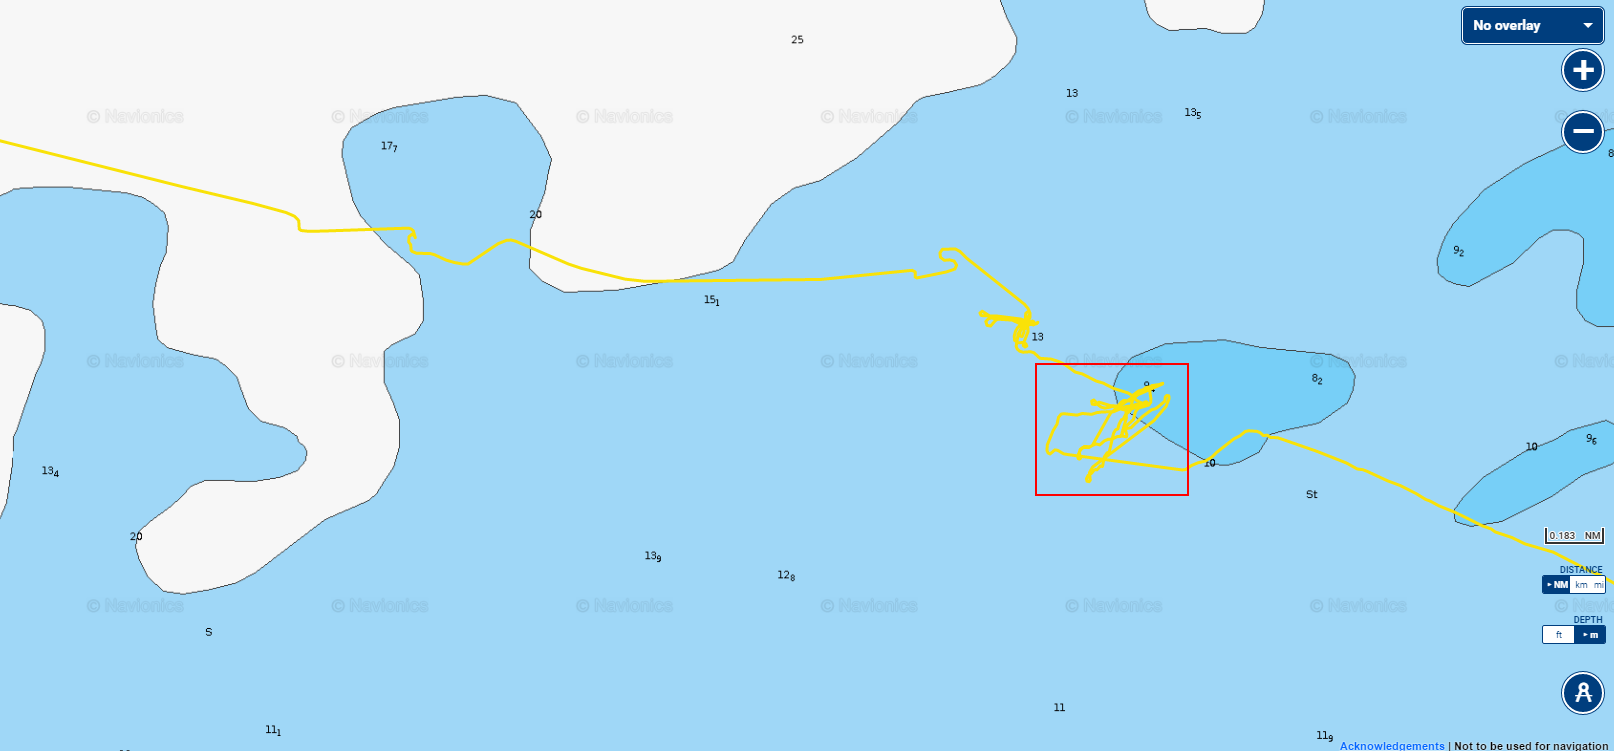
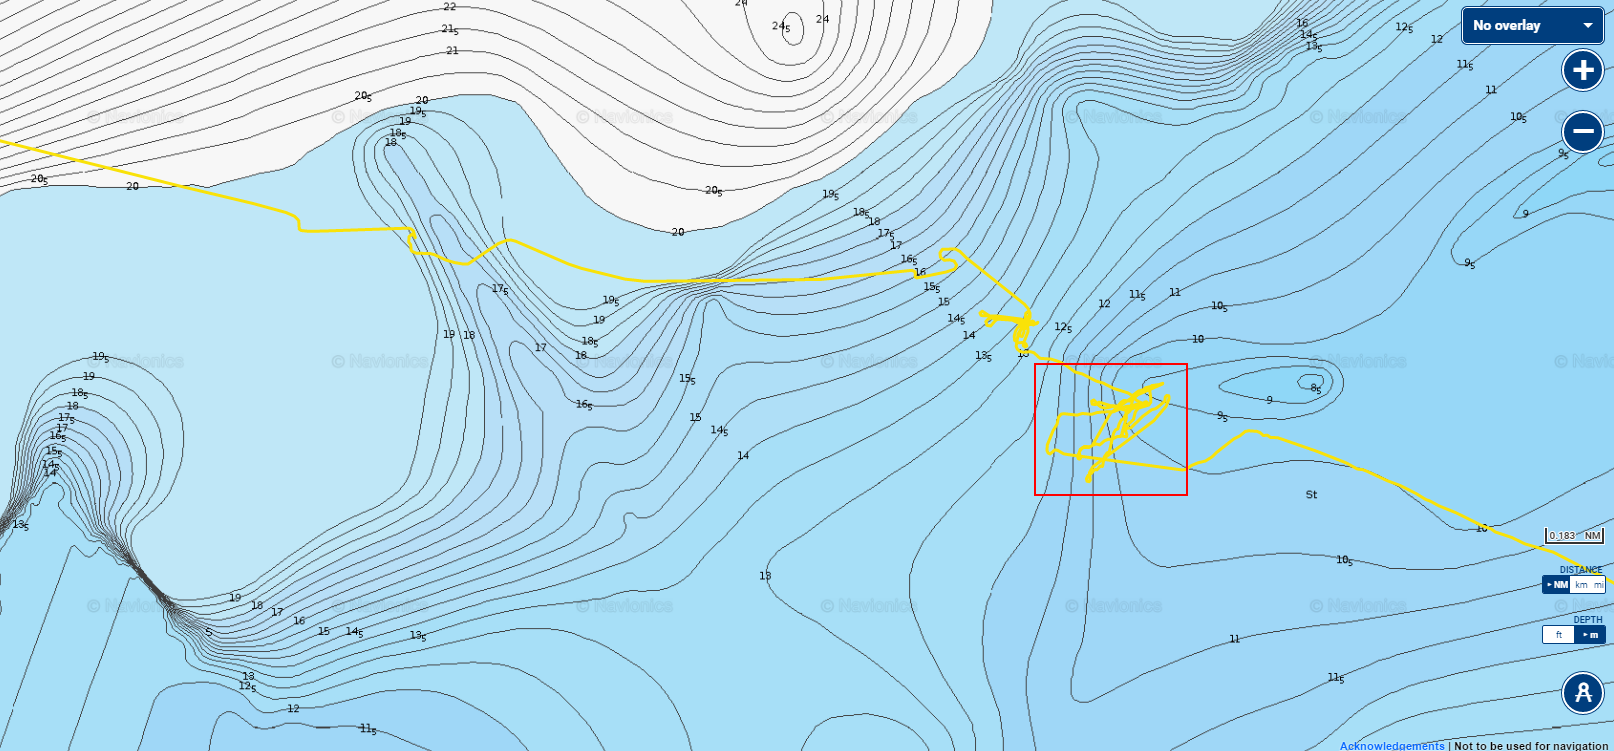
As we can see, the real bank location and depths are very different from the Navionics chart and even from the Navionics SonarChart. In practice, the depth changes sharply from 21 to 12 meter in the area shown on Navionics charts as a smooth change from 12 to 9.5 meters.
Many cod fishers on the Baltic Sea have a set of "cod points" for GPS. And sometimes it is hard to locate points even with the help of a chart plotter, because the slopes are narrow, and banks are small and move during the winter. However, with the help of ReefMaster we can get the real seabed picture easily.
Many plotters save depth data in GPX tracks. ReefMaster can digest some kinds of Lowrance and Humminbird native files, also. So, why do you need the Voyage Recorder to get a depth map? You will never forget to press the "Start track" button with it.
To learn more about the ReefMaster see: www.reefmaster.com.au.
To learn more about the Voyage Recorder see: www.yachtd.com/products/recorder.html.
Next articles:
- Updates for Text Display and Voyage Recorder / May 16, 2016
- Review of our Instruments Text Display in Panbo Marine Electronics Blog / April 20, 2016
- The Display is in stock / April 6, 2016
Previous articles:
- Review of our Instruments Text Display in SailBits / June 9, 2016
- Support of engine motor hours and filtering of the NMEA 2000 stream / June 29, 2016
- Firmware update 1.02i for the Display / July 23, 2016
See also: recent news, all news...